Professional Maps
Professional Maps show several parameters for the ECMWF and NCEP (GFS). Data are available for 240 hours. You can select model, model run, parameter and time step. The maps can also show as an animation.
Professional Maps
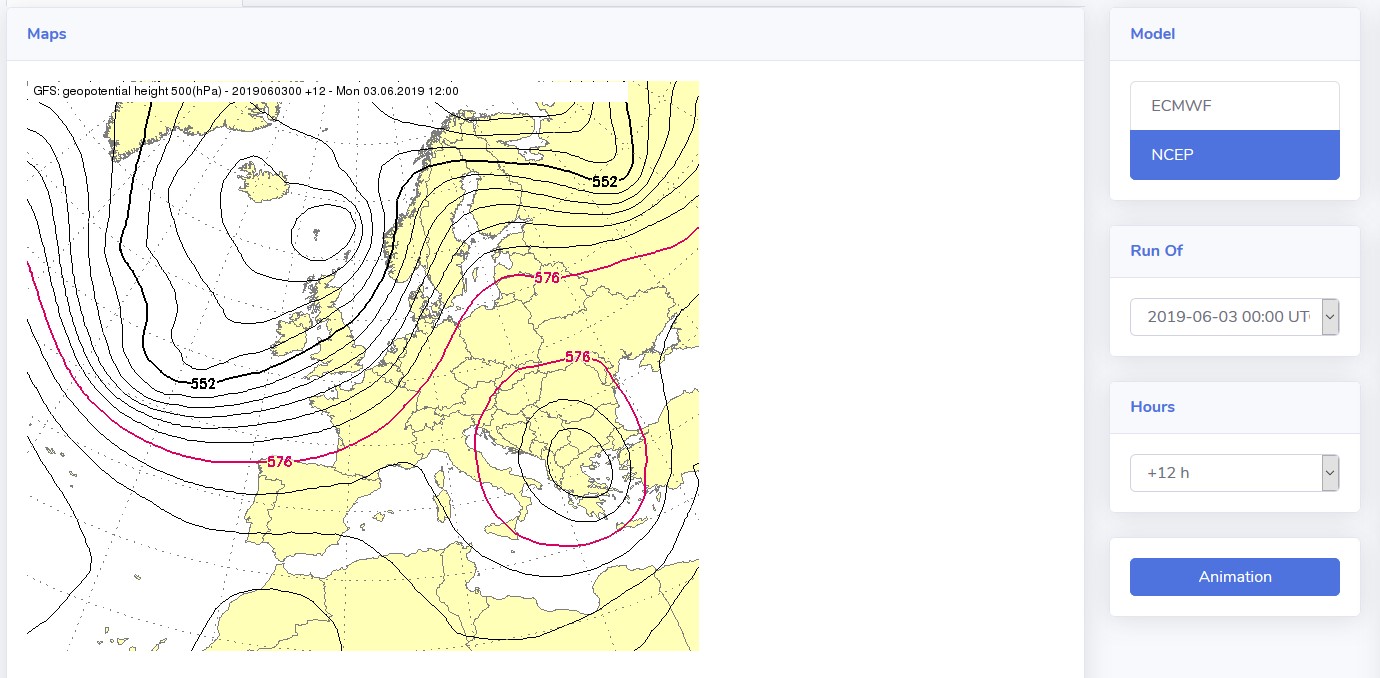
500 hPa geopotential height
At the 500 hPa level you can see the long atmospheric waves at a height of around 5.000 to 5.500 meters. The long waves navigate the weather at the ground. You can see troughs and ridges. They give informations about the dynamics of the atmosphere.
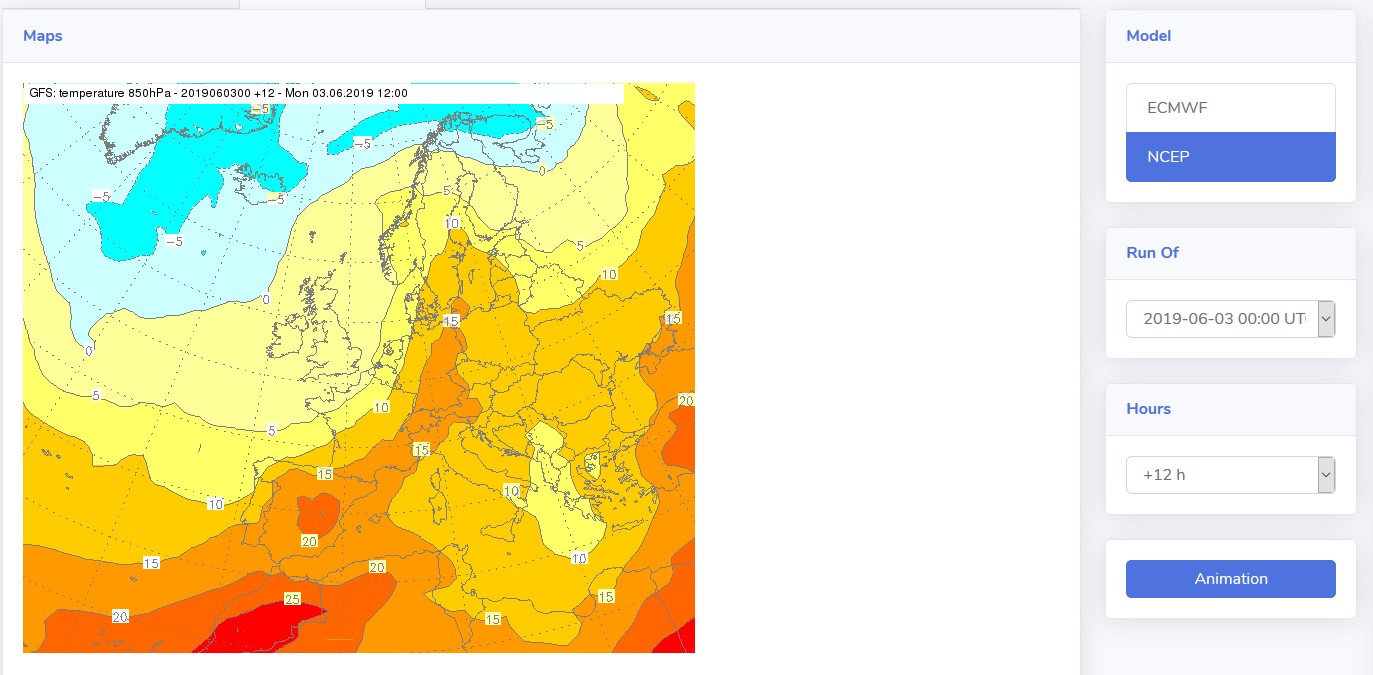
850 hPa temperature
The gradient of temperature lines at the 850 hPa level gives information about the position of a front in the atmosphere. In addition you can see warm and cold areas. From this level you can evaluate the temperature at ground level (2m temperature).
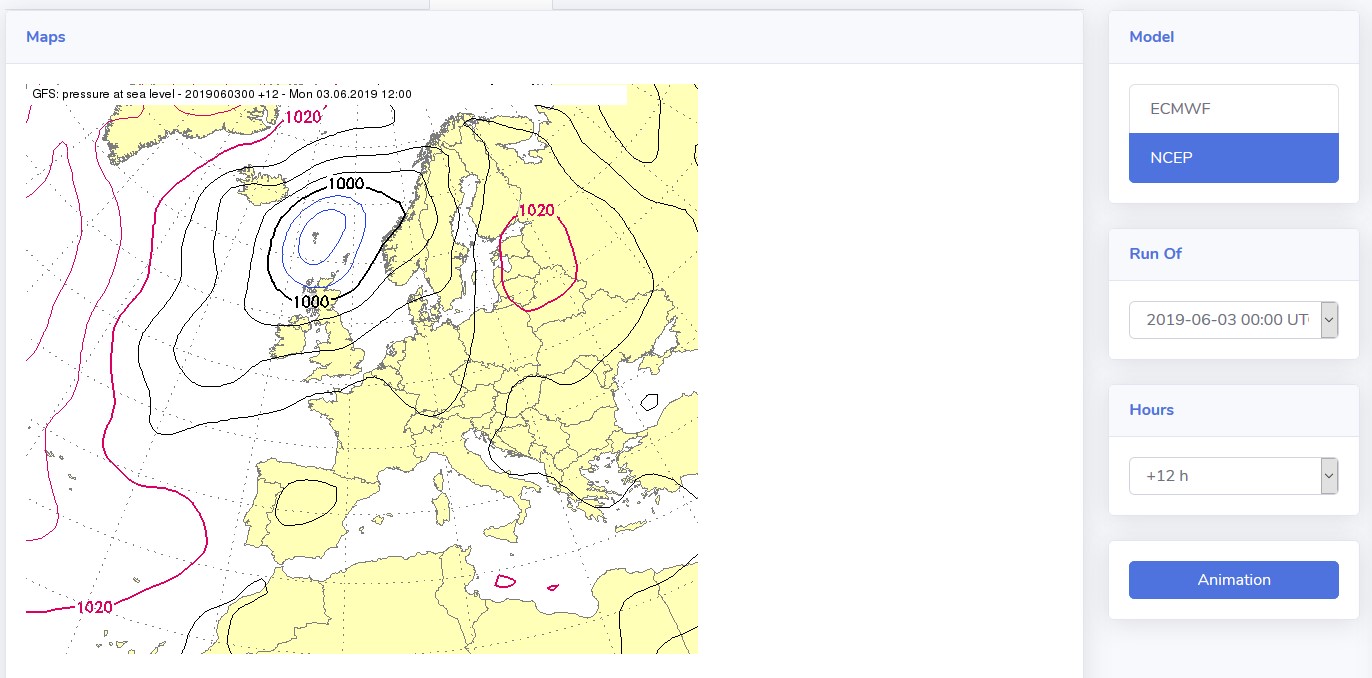
Pressure at sea level
The isobar animation shows you pressure distribution and pressure changes in Europe. Large concentrations of isobars indicate strong wind fields.
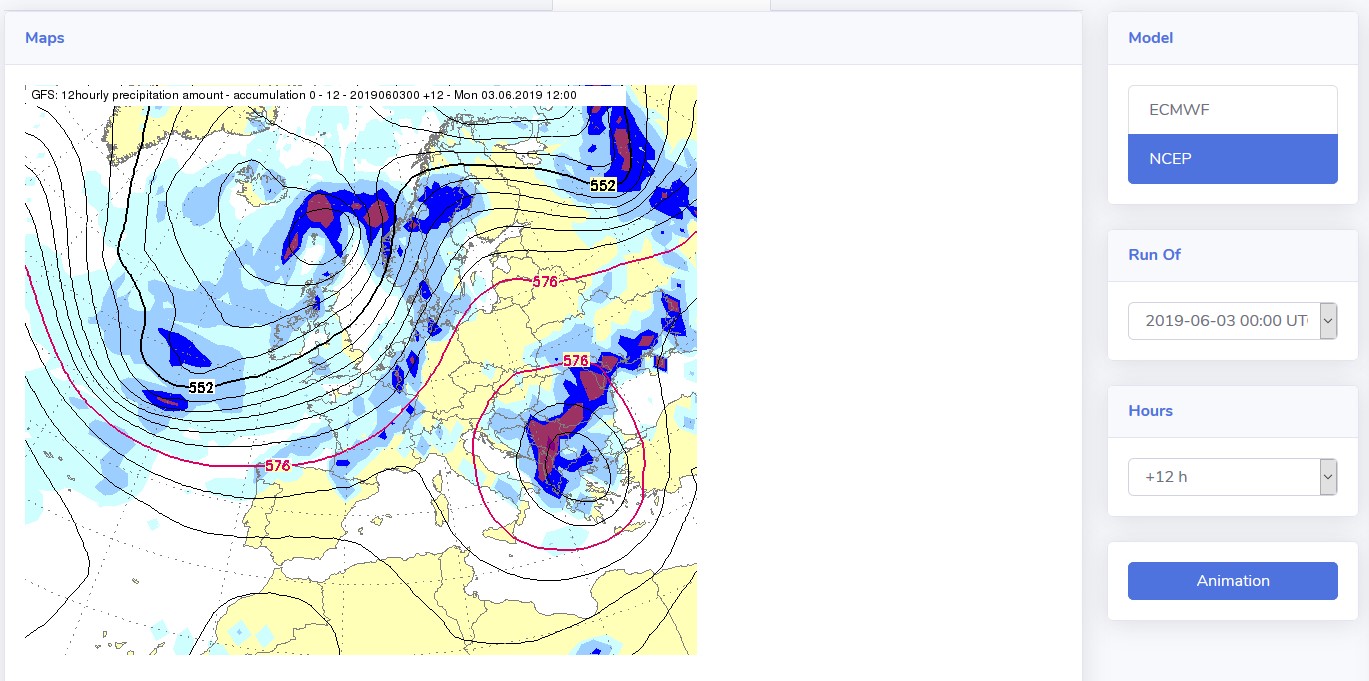
500 hPa height / precipitation
This map shows a combination of the long waves at the upper atmosphere and the production of precipitation at the ground level.
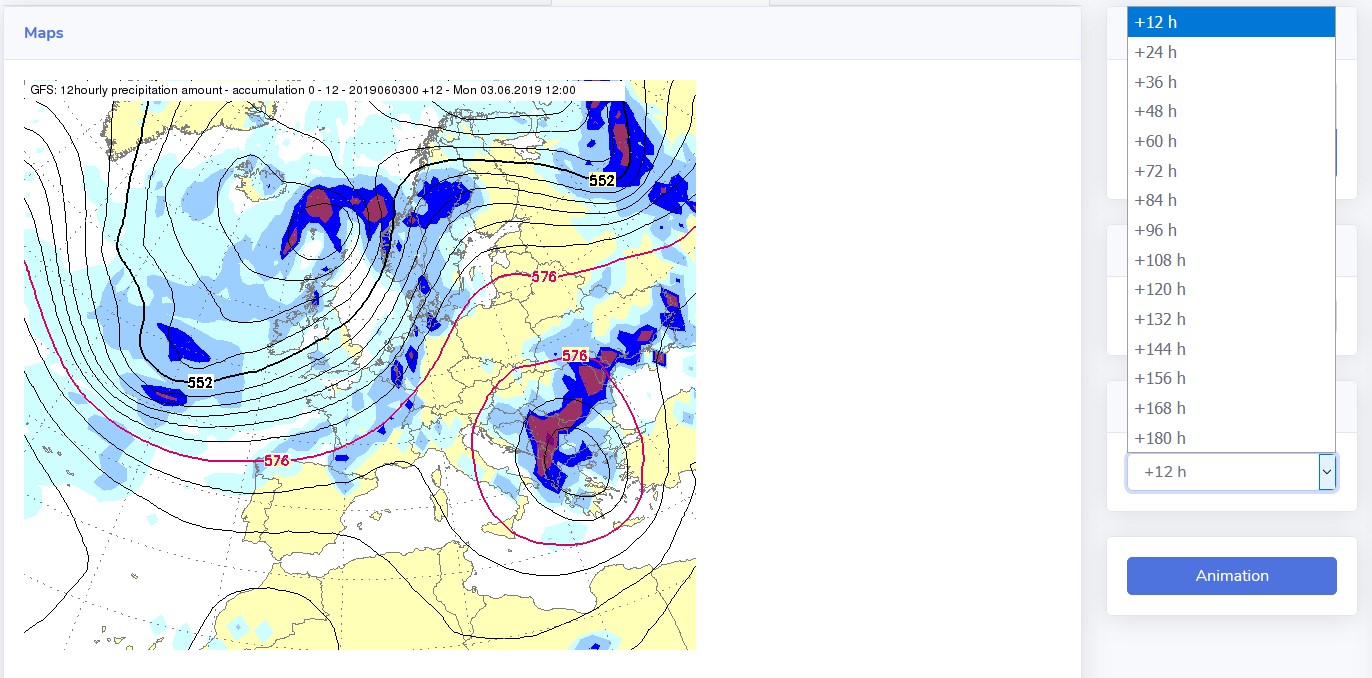
Precipitation
The maps shows the distribution and the amount of precipitation over Europe. Sometimes it aids in identifying frontal zones and their direction of movement.